
Ensign Capital Management, Inc.
Timing is Everything
Navigation
ECM Gold Miners Strategy (hypothetical)
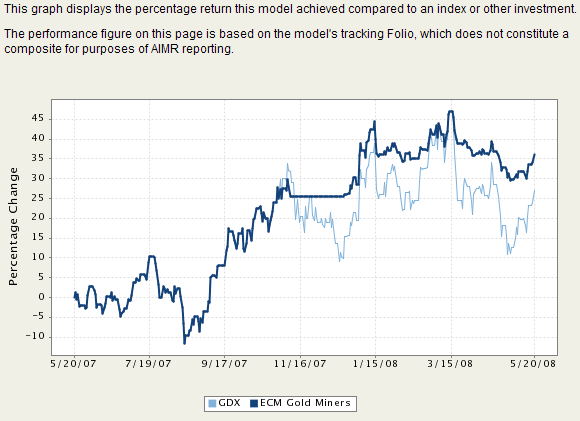
This chart illustrates the performance of the ECM Gold Miners strategy for the period shown. The light blue line is the performance of the GDX ETF. The dark blue line is the ECM Gold Miners performance. No hypothetical management fee has been deducted from the managed strategy. The chart period is from 5/21/2007 to 5/21/2008.
The results shown here are hypothetical and are intended to give a general approximation of what might have happened had an investor used the underlying strategy in a real account, in this case the ECM Gold Miners Strategy. Actual performance will vary depending on underlying management and custodial fees, the time the client begain the straegy, and other factors. The chart above does not represent a real account but a model account from which real accounts were managed. Ensign Capital Management is not an investment advisor. This and other ECM strategies are only available through Garrett Capital, Inc., a Registered Investment Advisor. Ensign Capital does not offer investment advice.